We have the pleasure of presenting new functions for the management and group comparisons in the Radars of Competences.
With these features you can:
- Download all project answers and data in excel
- Generate and download a Radar group report comparing all the evaluated
- Visualize a comparative table of self-evaluation of all the evaluated and download it in PDF or image format
- Visualize a spider graph with the average value of the evaluated and download it in PDF or image format
- To visualize a comparative graph of every evaluated with the average value of the others and to download it in PDF or image format
Now, within a Radar project you will see a button called “Group Data”
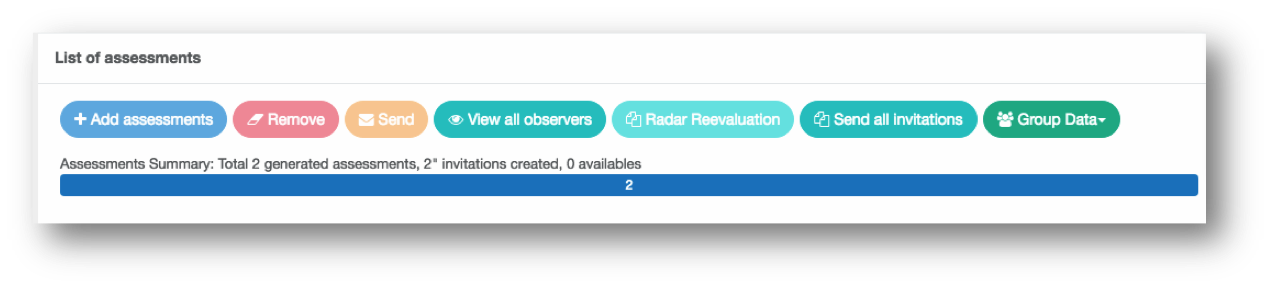
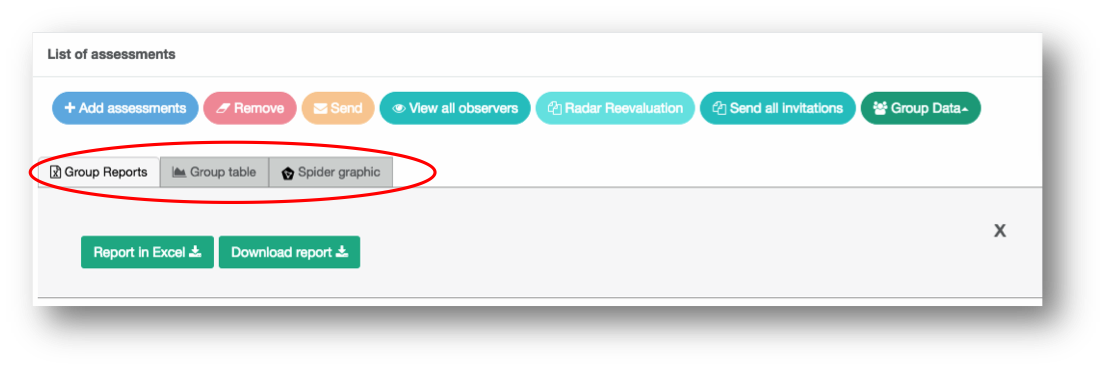
When clicking, a screen with 3 tabs is displayed: “Group Reports”; “Group table”; “Spider graphic”. Clicking it again you can close the view of tabs
- Tab “Group reports”: It is the default tab and allows two things.
- Download all the project data in excel, including all the evaluations of all the tests
- Download in PDF a group report that compares all those evaluated among them
2. Tab “Group table”: Display a table that compares the self-evaluations of all those evaluated in the project. It also has a button that allows you to download the table in PDF or PNG to be able to use it in presentations, documents, etc.
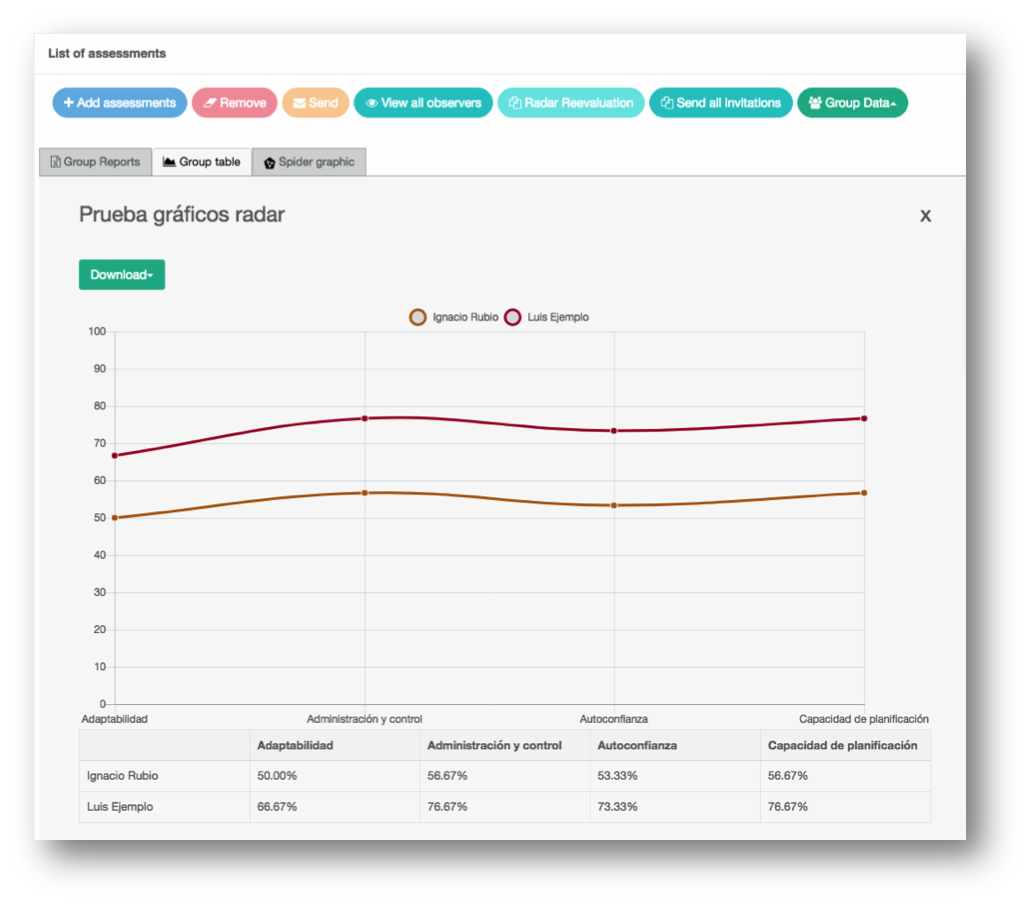
3. “Spider graph” tab: It shows a comparison of the average self-evaluations of the group, the average of observers; and the average of the set of both valuations. As in the previous case, it has a button that allows you to download the table in PDF or PNG in order to use it in presentations, documents, etc.

4. Individual comparison of evaluated: Next to the download button of the reports you will see a button called “Comparison”.
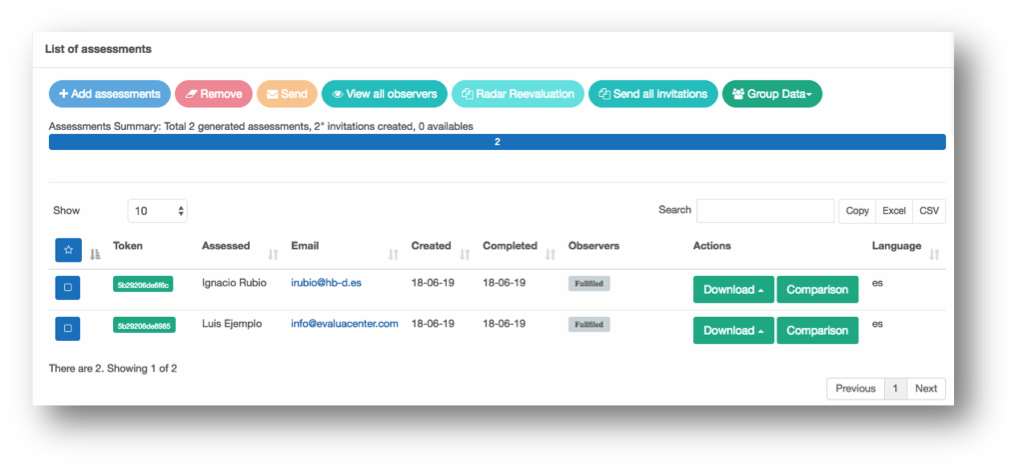
When clicking on the comparrision button, a comparative graph of the evaluated group will be displayed. If you click on any of the measurement labels, it will be hidden. As in the previous case, it has a button that allows you to download the table in PDF or PNG in order to use it in presentations, documents, etc.
