by administrador | Dec 13, 2018 | News
We are pleased to present to you a new DISC report that compares, in a personalized way, an evaluated with an objective profile.
Unlike the Recruiting Map which compares the profiles of several people evaluated against the target only on the map, the new report compares the DISC graph with the graph of the job profile, also compares the primary and secondary characteristics of the person with those of the job, also includes the area of improvement and the recruitment map. This new individualized report has a cost of 2 credits, our Recruitment Map remains without cost.
How is this new report generated?
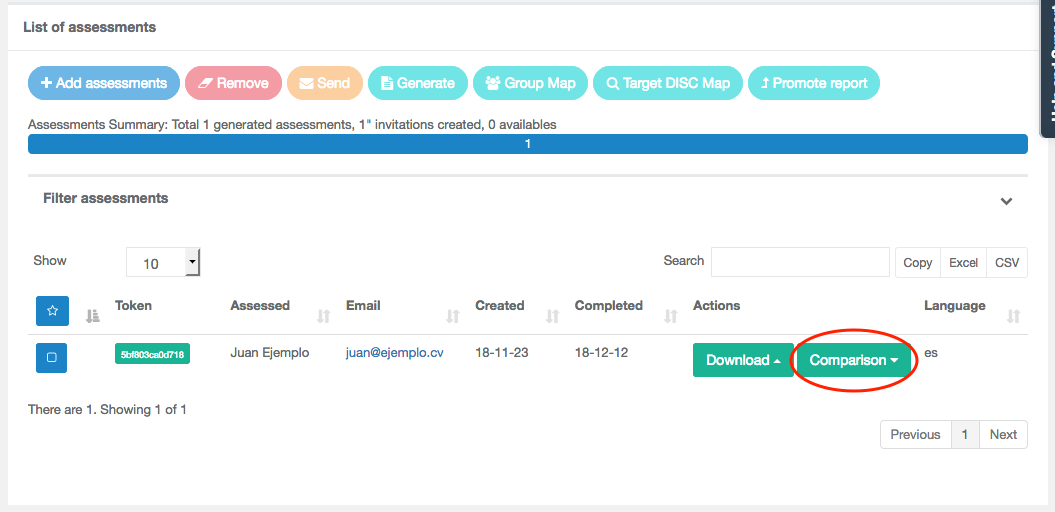
In order to generate this new report we must have enough credits. Once inside a DISC project we will see that in the table of evaluated with generated report there is a new button called “Comparison”.

Clicking on the button will open a new dialog where we will see the list of target profiles we have created and we can select one, once selected click on the “Generate” button.
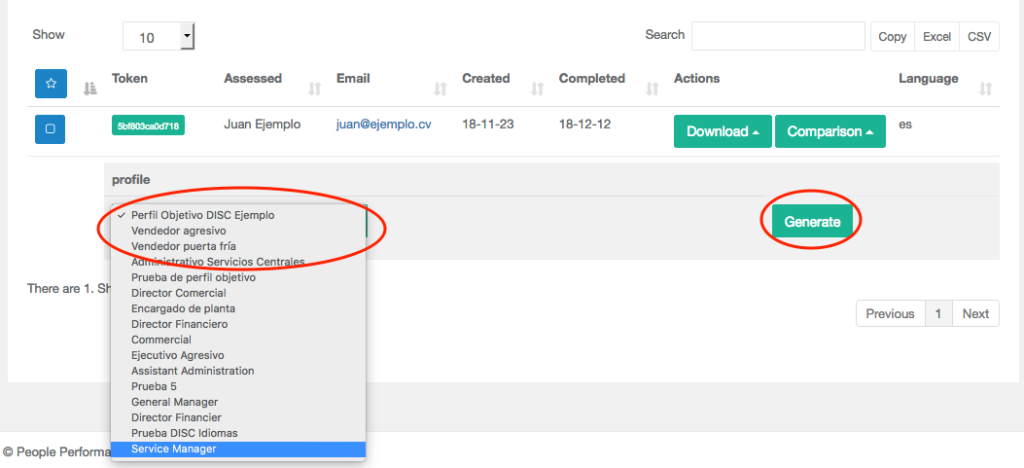

The system will inform us of the cost and whether we are sure if we want to generate it, and when we do, we will get the download button in different languages. Please note that once generated can not be deleted or go back, so it is important to be sure that this is the right profile. You can generate several reports to the same evaluated.

You can download a report example here
by administrador | Nov 9, 2018 | News
We have improved with new options the configuration of projects of Radar of Competences.
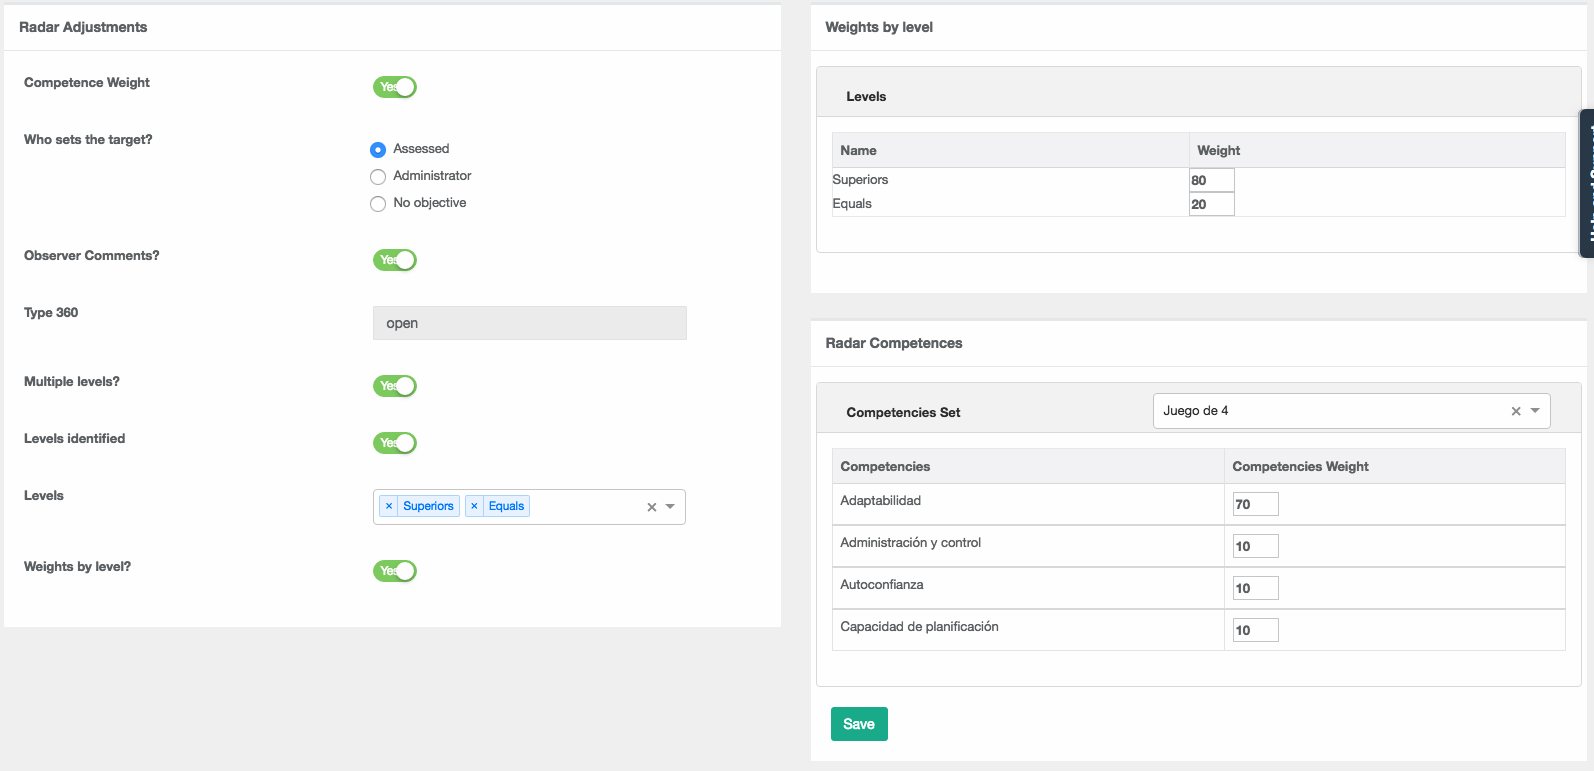
When creating a radar project you will see several new options on the project options screen
- Weight of competences (existing): Allows to put weight to the competences that have an impact on the total final score of the person evaluated.
- Who sets the target? (new): Now it is also possible to create projects without having a desired objective.
- Are comments allowed? (new): Allows observers to put personal comments in their assessment of the questions.
- Multiple levels? (existing): Allows observers to be differentiated by categories or levels
- Identified levels (existing): Allows observers to be grouped by categories or levels or by number so that the levels are not identified.
- Levels (existing): Choosing identified levels allows you to choose different levels, choosing unidentified levels allows you to choose the number of numbered levels
- Weight by level? (new): Allows different weights to be given to the levels or categories of observers that affect the total final score of the person evaluated.
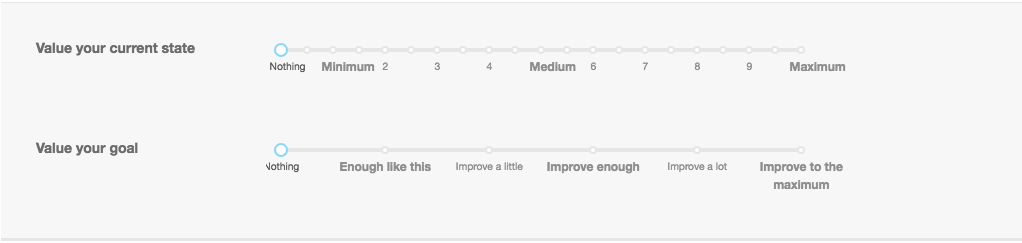
Now the Radar test can be rated at scores of 0.5 for greater accuracy in the rating.
In addition, when the project is configured so that the evaluated person also values the desired objective, we have incorporated a new type of questioning that has given a more accurate result in the studies and tests that we have carried out.
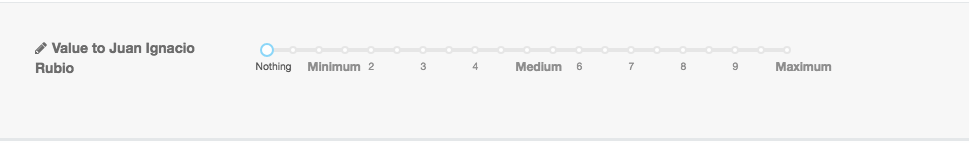
If this has been configured in the options, the observers will see a pencil icon that when clicking opens a window for entering comments on each question (this is indicated in the test instructions). The comments will be reflected on the last page of the report, identified only by their level.

In the report you will see a new page with indicators of the total valuation including the weighting of competences and levels of observers (if these options were activated).

by administrador | Nov 9, 2018 | News
Thanks to our LATAM team in the health area in collaboration with several hospitals and health entities we have developed, based on WHO recommendations, the DISC module of Health Area Competencies.
The module shows the valuation with respect to the NATURAL potential and the current approach (ADAPTATION) of the evaluated in key competencies of the health sector based on WHO recommendations. This assessment is NOT an assessment of your competence performance in each competence, but the NATURAL valuation represents your instinctive or natural potential to show or develop that competence more easily, i.e. your performance or development requires less additional effort. Your ADAPTED assessment represents where you are investing your energy or where you perceive that you should invest it for successful performance in that area.
Anything over 50% involves little effort, the higher the percentage, the lower the effort. Anything below 50% implies a little more effort, the lower the percentage, the greater the effort, but in no case does it limit how the person evaluated can develop or has developed those competencies if he or she has worked on them, since this is not what we assess.
Competencies are divided into two groups, the so-called “Patient Safety” competencies and the “Operational” competencies. When reviewing the competencies, they should look at those that are key to the position held by the person being assessed and ignore the rest.
Example of the module
by administrador | Jul 11, 2018 | News
We have the pleasure of presenting new functions for the management and group comparisons in the Radars of Competences.
With these features you can:
- Download all project answers and data in excel
- Generate and download a Radar group report comparing all the evaluated
- Visualize a comparative table of self-evaluation of all the evaluated and download it in PDF or image format
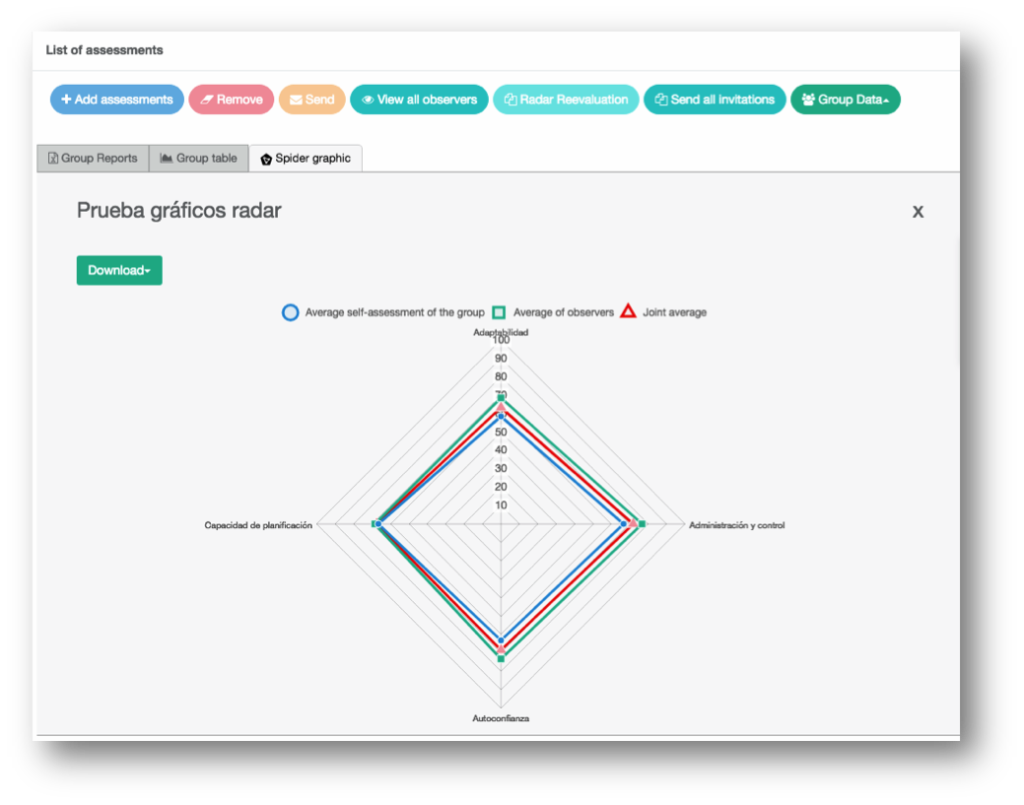
- Visualize a spider graph with the average value of the evaluated and download it in PDF or image format
- To visualize a comparative graph of every evaluated with the average value of the others and to download it in PDF or image format
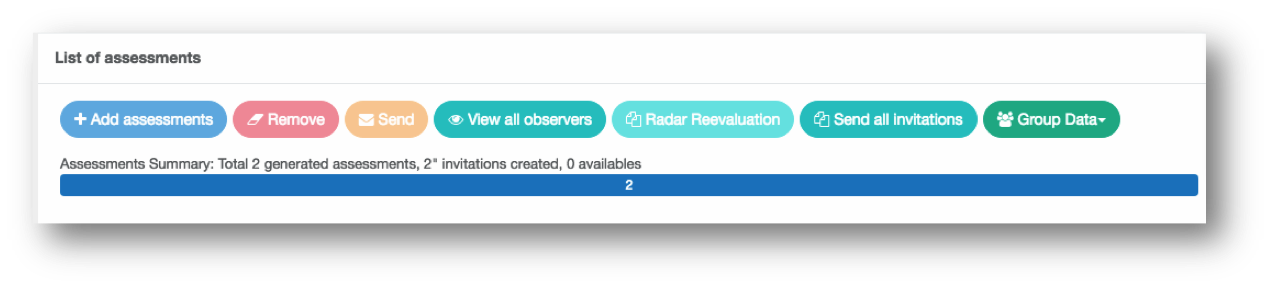
Now, within a Radar project you will see a button called “Group Data”

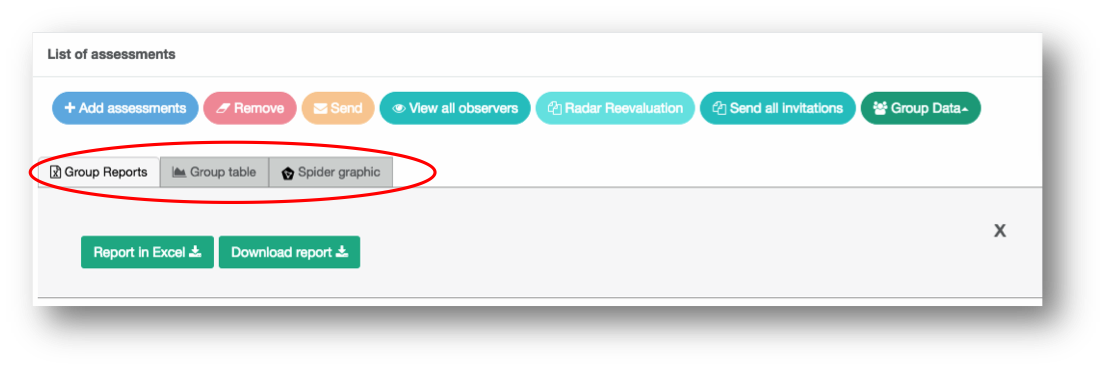
When clicking, a screen with 3 tabs is displayed: “Group Reports”; “Group table”; “Spider graphic”. Clicking it again you can close the view of tabs
- Tab “Group reports”: It is the default tab and allows two things.
- Download all the project data in excel, including all the evaluations of all the tests
- Download in PDF a group report that compares all those evaluated among them

2. Tab “Group table”: Display a table that compares the self-evaluations of all those evaluated in the project. It also has a button that allows you to download the table in PDF or PNG to be able to use it in presentations, documents, etc.

3. “Spider graph” tab: It shows a comparison of the average self-evaluations of the group, the average of observers; and the average of the set of both valuations. As in the previous case, it has a button that allows you to download the table in PDF or PNG in order to use it in presentations, documents, etc.
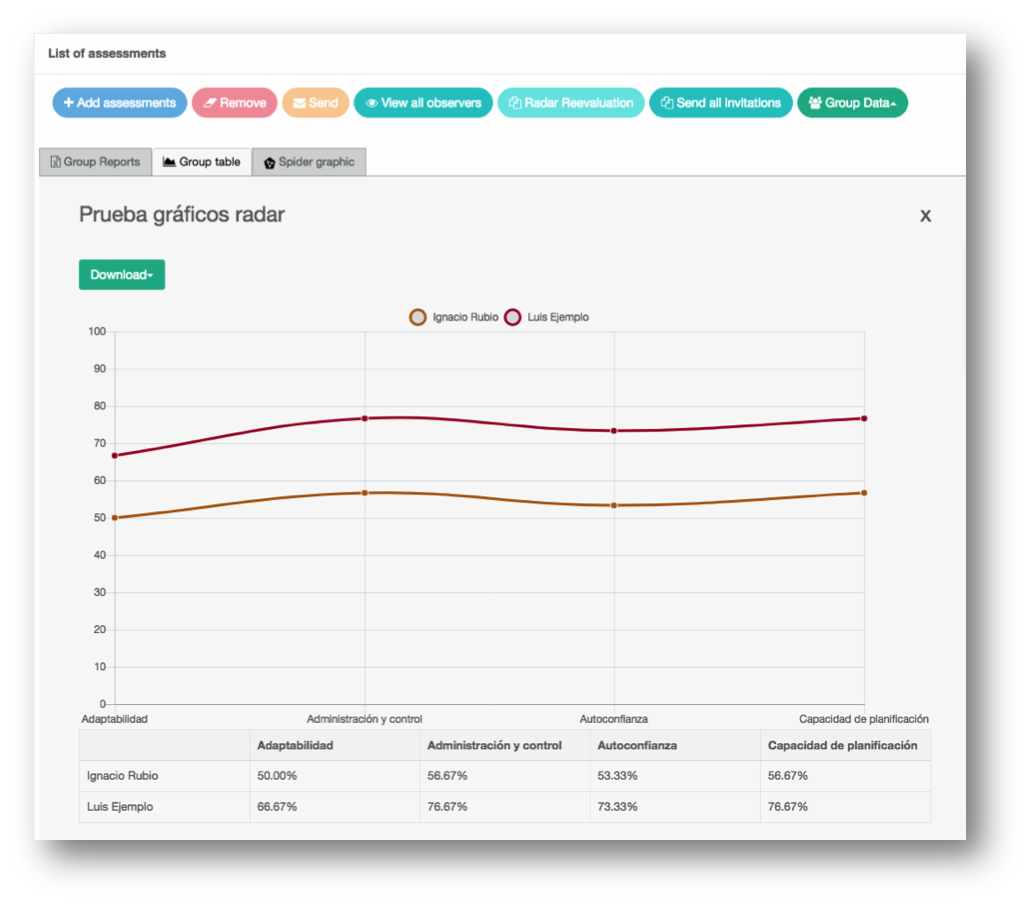
4. Individual comparison of evaluated: Next to the download button of the reports you will see a button called “Comparison”.
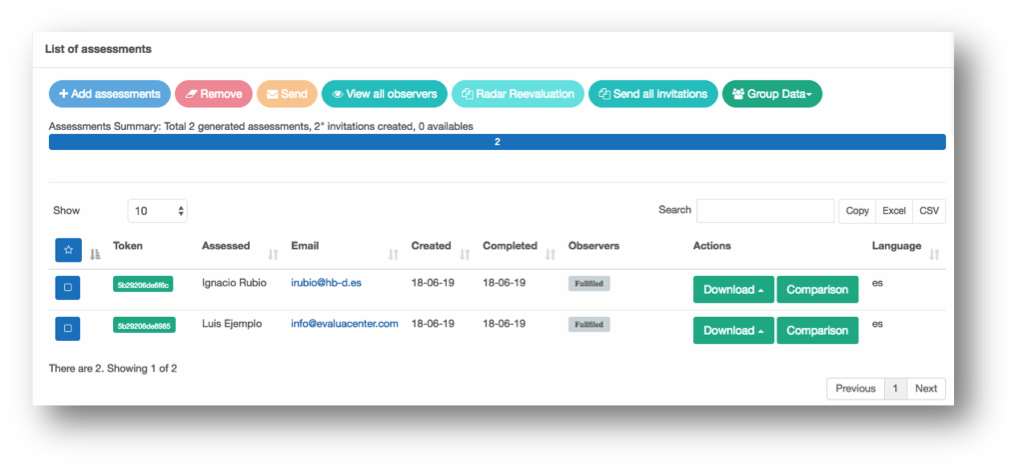
When clicking on the comparrision button, a comparative graph of the evaluated group will be displayed. If you click on any of the measurement labels, it will be hidden. As in the previous case, it has a button that allows you to download the table in PDF or PNG in order to use it in presentations, documents, etc.

by administrador | Jul 11, 2018 | News
The Customer Service Style DISC Module helps identify the characteristics of the evaluated when they have to serve or service customers. It is designed to take advantage of the strengths of their style and strengthen weaknesses, as well as help fit the right people in the right environment.
Type: Optional module to base report
Included in: DISC Professional
Pages: 3
Price: No cost
First page: Your style of Customer Service 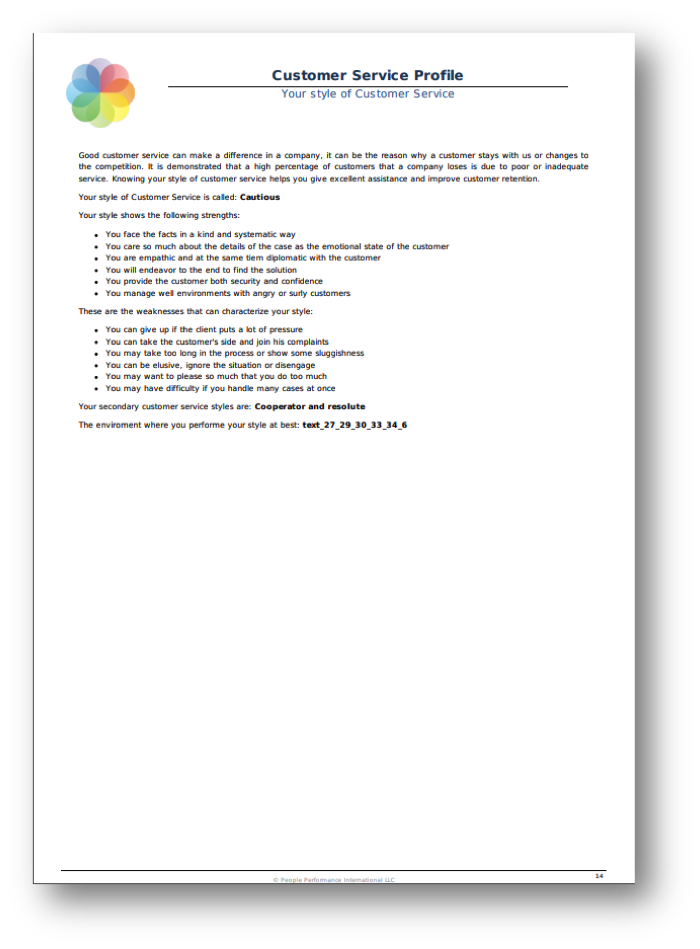
It is used both in recruitment and in development and training
Good customer service can make a difference in a company, it can be the reason why a customer stays with us or changes to the competition. It is demonstrated that a high percentage of customers that a company loses is due to poor or inadequate service. Knowing your style of customer service helps you give excellent assistance and improve customer retention.
This section is dynamic (according to the style of each evaluated)
It is divided into 6 sections:
- Explanatory introduction
- Name of the customer service style
- Strengths of style
- Weaknesses of style
- Secondary styles
- The environment in which this style best performs
Second page: Identifying the styles of the clients
It is mainly used is development and training
- It is a guide that helps the person identify with what type of client he is dealing with. This section is static (does not change)
Third page: Customer Service Strategy
It is mainly used in development and training
- Based on the evaluated Customer Service style, it helps him identify some basic strategies that you can follow when he has to service the clients. This section is dynamic (according to the style of each evaluated)
To download this information clic here
To download an example clic here
Summary table of customer service styles (does not appear in the report)
| Style |
Main characteristic |
Main weakness |
Ideal environment |
| Directive |
Faces the facts directly |
Can be sharp or be too strong |
Where hard environments need determination, where you have to be very proactive |
| Charismatic |
Faces the facts directly but very friendly |
May want to control the conversation |
Where proactivity and determination are needed, as well as fluency in interaction and communication |
| Persistent |
Faces the facts objectively but friendly |
Can be somewhat elusive with the customer |
Where you need to combine determination, kindness and persistence |
| Informal |
Faces the facts in a friendly way |
Can not really listen to the customer |
Where it is necessary great capacity for interaction, communication and kindness |
| Facilitator |
Faces the facts in a friendly way and at the same time calm |
May settle with the easiest solution, but not the most appropriate one |
Where good communication skills are needed as well as kindness and cooperation with the client |
| Adviser |
Faces the facts in a friendly but at the same time conscientious way |
Can be perceived as a smartass |
Where you have to combine good interaction and communication with details and data |
| Cooperator |
Faces the facts unhurried and friendly |
Can get to join the customer’s complaint as a way to pacify him |
Where kindness, serenity and endurance are fundamental and there are clear established procedures |
| Cautious |
Faces the facts in a kind and systematic way
|
Can give up if the client puts a lot of pressure |
Where you need a lot of kindness while following procedures to resolve issues |
| Technical |
Faces the facts conscientiously and systematically |
May not empathize with the customer |
In technical environments where information and details are the most important |
| Resolute |
Faces the facts directly and conscientiously |
May be too dry or hard
|
Where determination is needed while dealing with details and information in a thorough manner |
by administrador | May 16, 2018 | News
You can export all radar valuations to excel.
In any Competency Radar Project you will see a button called “Group Data”, when you click on it, a window will be displayed with the option to generate a report in excel.

The system will download an excel with those evaluated that have generated report.